Every agentic-report technique, told through one station network
Fictional sample. Kestrel is an invented network of six weather stations on one stretch of coast, run by volunteers for the harbour. This page follows it through the 2026 season, one technique per chapter, and puts the Markdown that draws each chapter under its result, so you can copy the part you need. The stations, the readings and the harbour are made up; every block on the page is built by the package from the source shown.
What Kestrel measures
Every ten minutes the stations report wind to the harbour page.
A volunteer adds a station with one command, kestrel add K6 --site new-breakwater, and the harbour master asked the network for one thing: to warn of a GaleWind of force 8 on the Beaufort scale: a mean speed of 34 to 40 knots.View full definition before it reaches the moles.
Gale
Wind of force 8 on the Beaufort scale: a mean speed of 34 to 40 knots.
:::lead
Every ten minutes the stations report :swap[wind]{words="gusts, rain, pressure"} to the harbour page.
:::

A volunteer adds a station with one command, :typing[kestrel add K6 --site new-breakwater], and the
harbour master asked the network for one thing: to warn of a :term[gale]{key="gale"} :mark[before]{shape="underline"}
it reaches the moles.

:::glossary{key="gale" term="Gale" forms="gales"}
Wind of force 8 on the Beaufort scale: a mean speed of 34 to 40 knots.
:::
Six stations, read from one export
The export taken lists
6 stations. The card is written once, and the build
repeats it for every station in data/.
Stations
K1 · North mole
Good
Reporting every ten minutes; 99% of the expected reports arrived this season.
K2 · Lighthouse point
Good
Reporting every ten minutes; 99% of the expected reports arrived this season.
K3 · Fish quay
Watch
Salt in the anemometer bearing; 96% of the expected reports arrived this season.
K4 · Dune school
Good
Reporting every ten minutes; 99% of the expected reports arrived this season.
K5 · Coastguard hut
At risk
Silent since the storm of 14 September; 88% of the expected reports arrived this season.
K6 · New breakwater
Good
Joined on 12 September; 100% of the expected reports arrived this season.
Source: Kestrel export, 106,240 reports from 6 stations ·
The frontmatter names the file, and expect fails the build if the export stops listing six stations.
A placeholder that names the page data is filled inside code blocks as well, so the listing below leaves
out the source line and keeps to the repeated card, whose s is not a data name.
---
data:
  - data/network.json
---

::expect{data="network.stations" count="6"}
::expect{data="network.stationCount" equals="6"}

:::::cards{title="Stations"}
::::each{in="network.stations" as="s"}
:::card{title="{{s.code}} · {{s.site.en}}" status="{{s.card}}"}
{{s.note.en}}; {{s.uptime}}% of the expected reports arrived this season.
:::
::::
:::::
The roster becomes cards on a phone
Each row of the roster is read on its own, so layout="stack" turns every row into a card on a narrow
screen, with the column headers as labels. On a wide screen it stays a table.
| Station | Site | Mast height | Sensors |
|---|---|---|---|
| K1 | North mole | 8 m | wind, gusts, pressure |
| K2 | Lighthouse point | 24 m | wind, gusts, visibility |
| K3 | Fish quay | 6 m | wind, rain |
| K4 | Dune school | 12 m | wind, rain, temperature |
| K5 | Coastguard hut | 18 m | wind, pressure |
| K6 | New breakwater | 7 m | wind, swell |
:::table{layout="stack"}

| Station | Site             | Mast height | Sensors                 |
| ------- | ---------------- | ----------- | ----------------------- |
| K1      | North mole       | 8 m         | wind, gusts, pressure   |
| K2      | Lighthouse point | 24 m        | wind, gusts, visibility |
| K3      | Fish quay        | 6 m         | wind, rain              |
| K4      | Dune school      | 12 m        | wind, rain, temperature |
| K5      | Coastguard hut   | 18 m        | wind, pressure          |
| K6      | New breakwater   | 7 m         | wind, swell             |

:::
A day of wind, wider than the column
On 18 September the mean wind at K2 rose from 15 to 38 knots and fell back by night. K5 is missing: it has been
silent since the storm of 14 September. The readings are compared across rows and hours, so the table keeps
its grid with layout="scroll". On a phone it scrolls sideways with the station code held in place, and
Open shows it full screen; the same control opens any diagram or chart wider than its column.
| Station | 00:00 | 02:00 | 04:00 | 06:00 | 08:00 | 10:00 | 12:00 | 14:00 | 16:00 | 18:00 | 20:00 | 22:00 |
|---|---|---|---|---|---|---|---|---|---|---|---|---|
| K1 | 12 | 11 | 12 | 15 | 20 | 24 | 28 | 33 | 33 | 30 | 23 | 17 |
| K2 | 16 | 15 | 16 | 19 | 24 | 29 | 33 | 38 | 38 | 35 | 28 | 21 |
| K3 | 8 | 7 | 8 | 11 | 16 | 20 | 24 | 29 | 29 | 25 | 18 | 12 |
| K4 | 10 | 9 | 10 | 13 | 18 | 22 | 26 | 29 | 30 | 27 | 20 | 15 |
| K6 | 13 | 12 | 13 | 16 | 21 | 25 | 30 | 35 | 35 | 32 | 25 | 18 |
Source: Kestrel export, mean wind in knots every two hours, five stations reporting ·
::::table{layout="scroll"}
:::each{in="network.day.rows" as="r"}

| Station    |     00:00 |     02:00 |     04:00 |     06:00 |     08:00 |     10:00 |     12:00 |     14:00 |     16:00 |     18:00 |     20:00 |     22:00 |
| ---------- | --------: | --------: | --------: | --------: | --------: | --------: | --------: | --------: | --------: | --------: | --------: | --------: |
| {{r.code}} | {{r.h00}} | {{r.h02}} | {{r.h04}} | {{r.h06}} | {{r.h08}} | {{r.h10}} | {{r.h12}} | {{r.h14}} | {{r.h16}} | {{r.h18}} | {{r.h20}} | {{r.h22}} |

:::
::::
The source lines under this table and under the chart below name the page data, so their listings leave them out.
Reports per month, counted from zero
The network opened in April with three stations and had six by September, so the growth of the monthly
count is the news of the season. count- grows the bars from zero when the chart comes into view; with
reduced motion they stand at their values.
- Reports
Source: Kestrel export, 106,240 reports in the season ·
::::::chart{title="Reports received per month" description="Ten-minute reports that reached the Kestrel server in each month of the 2026 season; September counts its first 20 days." type="bar" x-label="Month, 2026" y-label="Reports" count-up="true"}
:::::series{label="Reports"}
::::each{in="network.months" as="m"}
::point{label="{{m.label.en}}" value="{{m.reports}}"}
::::
:::::
::::::
The season, date by date
The network opens with K1, K2 and K4
stations join
Three stations report to the harbour page from the first day.
K3 joins at the fish quay
stations join
The lowest mast of the network, 6 metres above the quay.
K5 joins at the coastguard hut
stations join
It covers the coast east of the lighthouse.
K6 joins on the new breakwater
stations join
Mounted in the scroll-scene chapter below, it is the sixth station.
The storm silences K5
a station goes silent
K5 stops reporting; a volunteer will reach it when the sea calms.
- stations join
- a station goes silent
::::timeline{title="Kestrel season 2026" description="When each station joined and when the storm silenced K5."}
:::event{date="3 April 2026" title="The network opens with K1, K2 and K4" kind="success"}
Three stations report to the harbour page from the first day.
:::
:::event{date="12 September 2026" title="K6 joins on the new breakwater" kind="success"}
Mounted in the scroll-scene chapter below, it is the sixth station.
:::
:::event{date="14 September 2026" title="The storm silences K5" kind="warning"}
K5 stops reporting; a volunteer will reach it when the sea calms.
:::
::legend-item{event="success" label="stations join"}
::legend-item{event="warning" label="a station goes silent"}
::::
The listing leaves out two of the five events; they are written the same way.
Firmware 2.4 went back twice
The release stands at Steps: Plan (done) → Build (done) → Field test (in review) → Ship (not started); returned from Field test to Build 2 times.. The field test on K3 sent the build back twice, both times for salt in the anemometer bearing. Each node carries its status, which reads without colour too, and «×2» on the connection says how many times the return happened.
- done
- in review
- returned
- not started
Diagram in words
Nodes: 5; flow layers: 4.
Layers along the flow
- Plan [done]
- Build [done]
- Field test — K3, fish quay [in review]; Radio approval [returned]
- Ship to stations [not started]
Connections along the flow
- Plan → Build
- Build → Field test
- Build → Radio approval
- Field test → Ship to stations
- Radio approval → Ship to stations
Connections back against the flow
- Field test → Build: salt in the bearing ×2
The release stands at :process[Plan > Build > Field test > Ship]{current="Field test" returns="Field test>Build×2"}.

:::diagram{title="Firmware 2.4 on its way to the stations" description="Plan and build are done; the field test on K3 returned the build twice and is running a third time; the radio approval came back once; shipping waits for both." layout="right"}
::node{id="plan" label="Plan" status="done"}
::node{id="build" label="Build" status="done"}
::node{id="field" label="Field test" detail="K3, fish quay" status="review"}
::node{id="radio" label="Radio approval" status="returned"}
::node{id="ship" label="Ship to stations" status="pending"}
::edge{from="plan" to="build"}
::edge{from="build" to="field"}
::edge{from="build" to="radio"}
::edge{from="field" to="build" label="salt in the bearing" count="2"}
::edge{from="field" to="ship"}
::edge{from="radio" to="ship"}
:::
Inside the Kestrel server
Readings travel from the stations through one radio gateway to the Kestrel server. The server is a small
flow of its own, so the diagram carries a zoom: while the diagram is pinned, the camera flies into the
server node and its inside grows readable in its place. Without motion the two drawings stand side by side.
The whole diagram
Inside the Kestrel server
- call
- data or values
Diagram in words
Nodes: 5; flow layers: 4.
Layers along the flow
- Six stations
- Radio gateway
- Kestrel server
- Harbour page; Archive
Connections along the flow
- Six stations → Radio gateway: every ten minutes (data or values)
- Radio gateway → Kestrel server: readings (data or values)
- Kestrel server → Harbour page: publishes (call)
- Kestrel server → Archive: stores (call)
Inside “Kestrel server”
- Inside the Kestrel server
- Nodes: 3; flow layers: 3.
- Layers along the flow: Intake; Quality check; Publisher
- Connections along the flow: Intake → Quality check (call); Quality check → Publisher (call)
::::diagram{title="From station to harbour page" description="Stations send readings through the radio gateway to the Kestrel server, which publishes the harbour page and keeps the archive."}
::node{id="stations" label="Six stations"}
::node{id="gateway" label="Radio gateway"}
::node{id="server" label="Kestrel server"}
::node{id="page" label="Harbour page"}
::node{id="archive" label="Archive"}
::edge{from="stations" to="gateway" label="every ten minutes" kind="data"}
::edge{from="gateway" to="server" label="readings" kind="data"}
::edge{from="server" to="page" label="publishes"}
::edge{from="server" to="archive" label="stores"}
:::zoom{node="server" title="Inside the Kestrel server"}
::node{id="intake" label="Intake"}
::node{id="check" label="Quality check"}
::node{id="publish" label="Publisher"}
::edge{from="intake" to="check"}
::edge{from="check" to="publish"}
:::
::::
A gale warning, played
At 14:00 on 18 September the lighthouse station measured a mean wind strong enough for a GaleWind of force 8 on the Beaufort scale: a mean speed of 34 to 40 knots.View full definition warning. The scene below plays the four log lines of that minute one by one; each beat lights its line, and the play button starts it again.
Gale warning, 18 September, 14:00
14:00:00  K2 lighthouse point  mean 38 kn  gust 44 kn
14:00:02  K2 logger            mean above 34 kn, flag GALE
14:00:05  server               GALE confirmed by K1, gust 41 kn
14:00:06  harbour page         gale warning shown for the moles
Reading
K2 measures a mean of 38 knots, gusting to 44, at the lighthouse point.
Flag
The station logger marks the reading as a gale.
Confirmation
The server waits for a second station before it believes one reading.
Warning
The harbour page shows the warning six seconds after the reading.
::::::demo{title="Gale warning, 18 September, 14:00" play="time" seconds="3"}

```text
14:00:00  K2 lighthouse point  mean 38 kn  gust 44 kn
14:00:02  K2 logger            mean above 34 kn, flag GALE
14:00:05  server               GALE confirmed by K1, gust 41 kn
14:00:06  harbour page         gale warning shown for the moles
```

:::beat{title="Reading" lines="1"}
K2 measures a mean of 38 knots, gusting to 44, at the lighthouse point.
:::

:::beat{title="Flag" lines="2"}
The station logger marks the reading as a gale.
:::

:::beat{title="Confirmation" lines="3"}
The server waits for a second station before it believes one reading.
:::

:::beat{title="Warning" lines="4"}
The harbour page shows the warning six seconds after the reading.
:::
::::::
Station K6 comes online
Diagram in words
Nodes: 3; flow layers: 3.
Layers along the flow
- Mast and sensors
- Logger
- Kestrel server
Connections along the flow
- Mast and sensors → Logger
- Logger → Kestrel server
Mast up
Volunteers raise a 7-metre mast on the new breakwater and fit the wind and swell sensors.
Logger paired
The logger pairs with the radio gateway on the lighthouse point.
First reading
On 12 September the first reading from K6 reaches the server.
How the scroll scene is written
The section above carries scene="scrub": the diagram stays on screen while the scroll plays three beats, and
each beat lights the nodes it names. A phone shows the diagram above the caption, one screen per beat.
::::section{title="Station K6 comes online" id="mount" nav="Scroll scene" scene="scrub"}

:::diagram{title="K6 joins the network" description="The sensors and logger of K6 and the Kestrel server." layout="right"}
::node{id="mast" label="Mast and sensors"}
::node{id="logger" label="Logger"}
::node{id="server" label="Kestrel server"}
::edge{from="mast" to="logger" kind="data"}
::edge{from="logger" to="server" kind="data"}
:::

:::beat{title="Mast up" focus="mast"}
Volunteers raise a 7-metre mast on the new breakwater and fit the wind and swell sensors.
:::

:::beat{title="Logger paired" focus="logger"}
The logger pairs with the radio gateway on the lighthouse point.
:::

:::beat{title="First reading" focus="logger, server"}
On 12 September the first reading from K6 reaches the server.
:::

::::
Where the stations stand
The map is drawn twice, on a light sea and on a dark one, and dark names the second file: the reader
sees the variant of the scheme the page is in, and the scheme toggle switches it live. spotlight puts a
loupe over the harbour, where three stations stand close together.
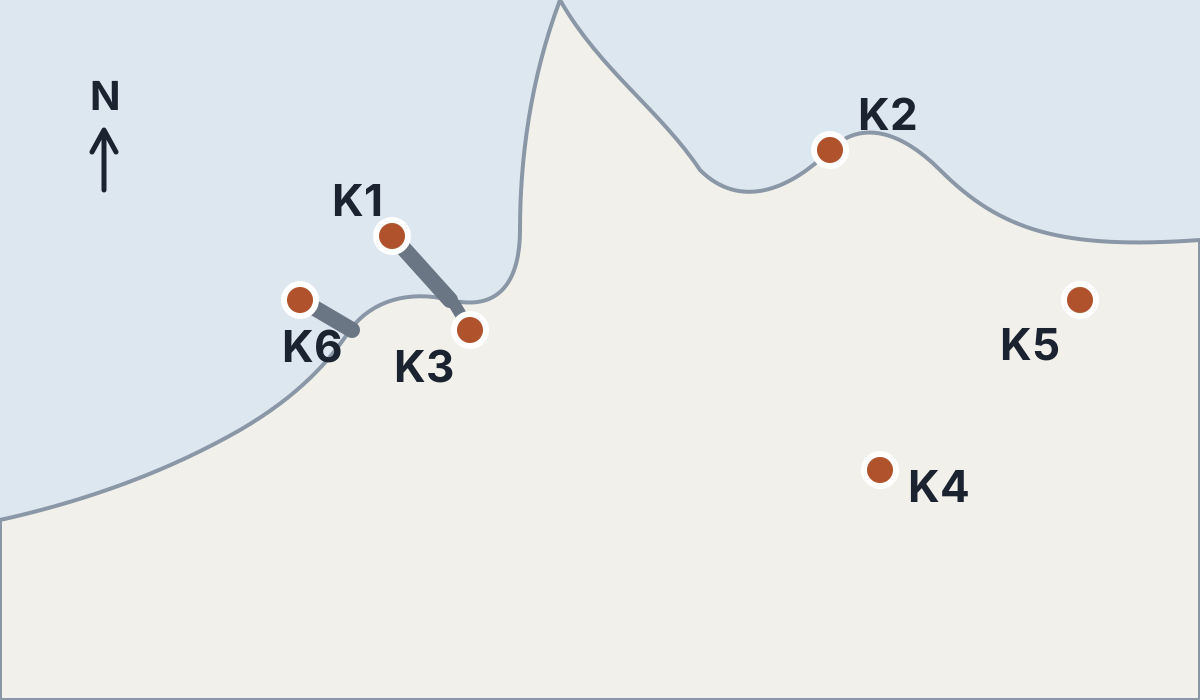
Three stations guard the harbour
K1 on the north mole, K6 on the new breakwater and K3 at the fish quay stand a few hundred metres apart, so a gust at the harbour mouth reaches all three within a minute.
:::spotlight{x="31" y="42" zoom="1.5" title="Three stations guard the harbour"}
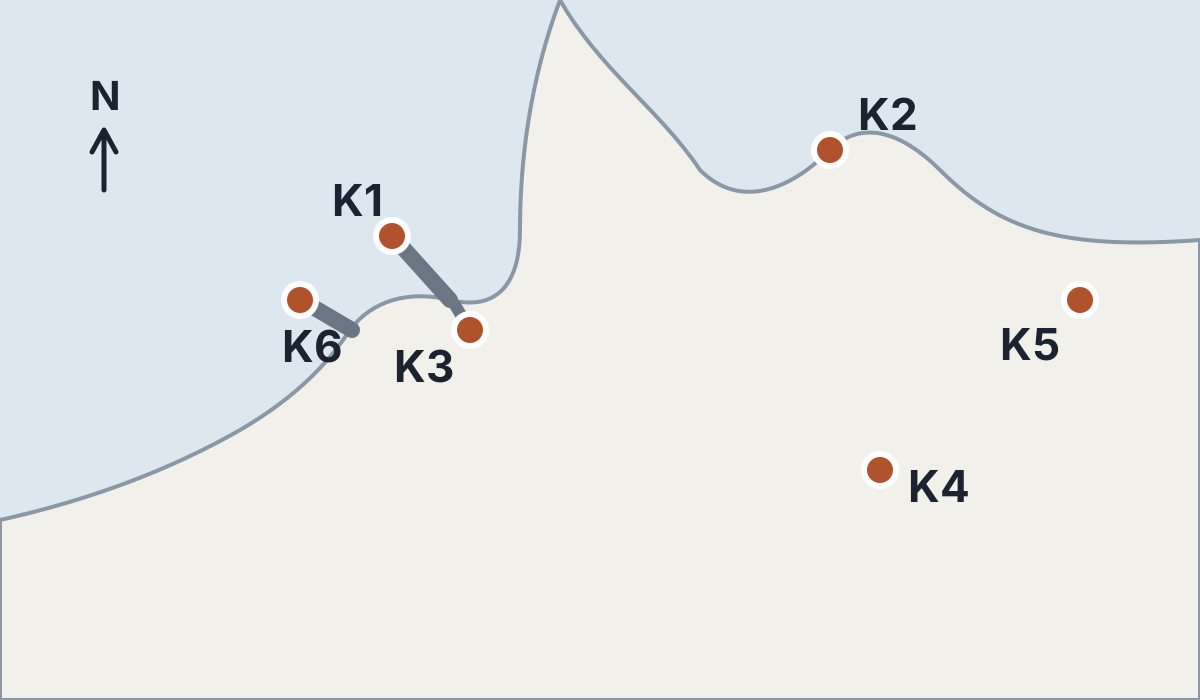{dark="assets/coast-dark.svg"}
K1 on the north mole, K6 on the new breakwater and K3 at the fish quay stand a few hundred metres apart, so
a gust at the harbour mouth reaches all three within a minute.
:::The season in four screens
One source takes one layout, and this guide is a document. The companion page
the Kestrel season in four screens says layout: screens in its frontmatter, and one
wheel turn, swipe or key press moves exactly one screen. The clip below records a reader flipping through
it; from names the film that agentic- wrote, with its encodings and poster, and
dark- gives the first frame as it looks in the dark scheme.
---
title: The Kestrel season in four screens
layout: screens
progress: nodes
theme: kestrel-theme.yaml
---

::video{from="assets/film" dark-poster="assets/season-poster-dark.webp" caption="The four-screen companion page, recorded as a reader flips through it."}
The first block shows the layout lines of the frontmatter of screens., without its
description, language and localizations; the video line belongs to this page.
The season briefing, as slides
A document can carry a few slides of its own. The harbour meeting gets the season in three slides; they are part of this page, built with it, and open on the whole screen with the button under them.
Kestrel season briefing
:::::deck{title="Kestrel season briefing" id="briefing-deck"}
::::slide

## Six stations, one season

Every ten minutes, from April to September.
::::

::::slide{transition="push"}

## What went wrong

:::appear
Firmware 2.4 went back twice.
:::

:::appear{effect="fade"}
K5 fell silent after the September storm.
:::

:::notes
Say that no storm warning was missed.
:::
::::

::::slide{transition="zoom"}

## Next season

Two more stations on the north pier.
::::
:::::
A slide that holds appear steps or notes takes a longer fence than they do, and the deck a longer one
still. #briefing- opens the second slide.
Colours from the brand
Kestrel's colours are the chestnut back of the bird and the slate of its head. agentic-
took the two colours, kept their hue, moved their lightness until every contrast pair passes in both
schemes, and wrote the theme file this page uses. The chestnut became the accent, the slate the eyebrow
colour; in the dark scheme the link colour moved one step lighter.
agentic-report theme --colors "#b0532c,#4a6a8a" --extends daylight --output kestrel-theme.yamlname: kestrel-theme
extends: daylight
colors:
light:
accent: '#b0532c'
accentStrong: '#b0532c'
accentSoft: '#ffe9e1'
accent2: '#4a6a8a'
dark:
accent: '#b0532c'
accentStrong: '#c76841'
accentSoft: '#411e0f'
accent2: '#6081a2'The listing leaves out the comment line and the description, palette, focus and chart1 lines of
the file; the page names
it in its frontmatter as theme: kestrel-.
Calibration notes, for those who need them
Most readers need only the result of a calibration; the volunteer who services a mast needs the method. The method stays behind a disclosure, and the two sensors that differ get a tab each.
How a Kestrel anemometer is checked
A volunteer compares the station against a hand anemometer held at the same height for ten minutes. A difference above 2 knots sends the sensor to the bench.
Sensor checks
Once a season, and after every storm: the cups must spin freely and the bearing must be free of salt.
Once a month: the funnel is cleared of sand and the tipping bucket is tested with a measured litre.
:::disclosure{title="How a Kestrel anemometer is checked"}
A volunteer compares the station against a hand anemometer held at the same height for ten minutes. A
difference above 2 knots sends the sensor to the bench.
:::

::::tabs{title="Sensor checks"}
:::tab{label="Wind"}
Once a season, and after every storm: the cups must spin freely and the bearing must be free of salt.
:::
:::tab{label="Rain"}
Once a month: the funnel is cleared of sand and the tipping bucket is tested with a measured litre.
:::
::::
The chapter list at the top of the page is ::contents on a line of its own; the build writes it from the
chapter titles, and each nav label names the chapter in the side contents.
What changed since the last edition
Volunteers read the service notice for K3 twice: before the second field test and after it. The second
edition is built with --since and the first edition, so the page marks what changed: inserted and
removed words, a removed block left as a collapsed ghost, a changed code line, and a «Changes» list with a
switch to hide them.
agentic-report build edition-1.md --output notice.html
agentic-report build edition-2.md --output notice-2.html --since notice.html
This page cannot show the change layer on itself: an example is built from its source alone, without a
previous edition. The public site builds the notice both ways, so the pair can be opened side by side:
the first edition and the second edition with its changes.
Their sources, edition- and edition-, lie beside this page.